The Revenue Dashboard
The Revenue Dashboard gives you a comprehensive view of how your marketing activities are driving store revenue. It combines data from all channels — email, SMS, ads, and on-site — into a single unified view.
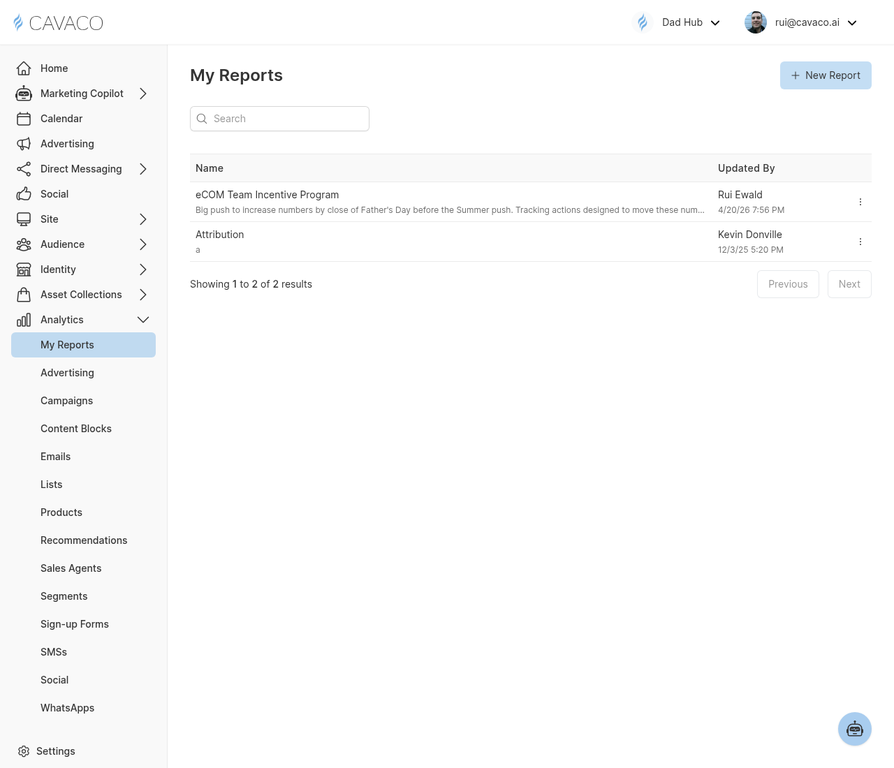
The Analytics module provides detailed revenue and campaign performance reporting.
Key Revenue Metrics
- Total Revenue — All revenue from your store in the selected period
- Cavaco-Attributed Revenue — Revenue from orders where a customer interacted with a Cavaco campaign within the 7-day attribution window
- Revenue per Email — Average revenue generated per email sent
- Revenue per SMS — Average revenue generated per SMS sent
- ROAS — Return on ad spend for paid advertising campaigns
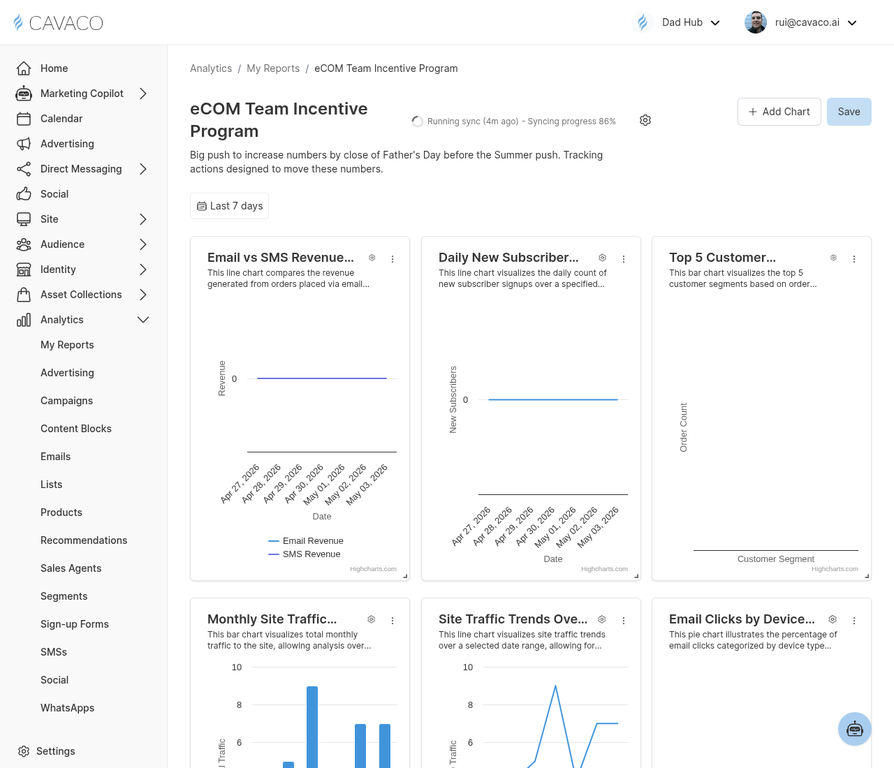
Detailed analytics reports show revenue attribution by channel, campaign, and segment.
Revenue by Channel
The channel breakdown shows how much revenue each marketing channel (email, SMS, ads, on-site widgets) is contributing. Use this view to identify your highest-performing channels and allocate budget accordingly.
Revenue by Campaign
Drill down to see revenue attributed to individual campaigns. This helps you identify your best-performing campaigns and replicate their success. Sort by revenue, conversion rate, or ROAS to find different types of winners.