Your Marketing Command Center
The Cavaco dashboard home is the first thing you see when you log in. It's designed to give you an immediate understanding of how your marketing is performing — revenue trends, campaign activity, and AI-powered recommendations — all without digging through reports.
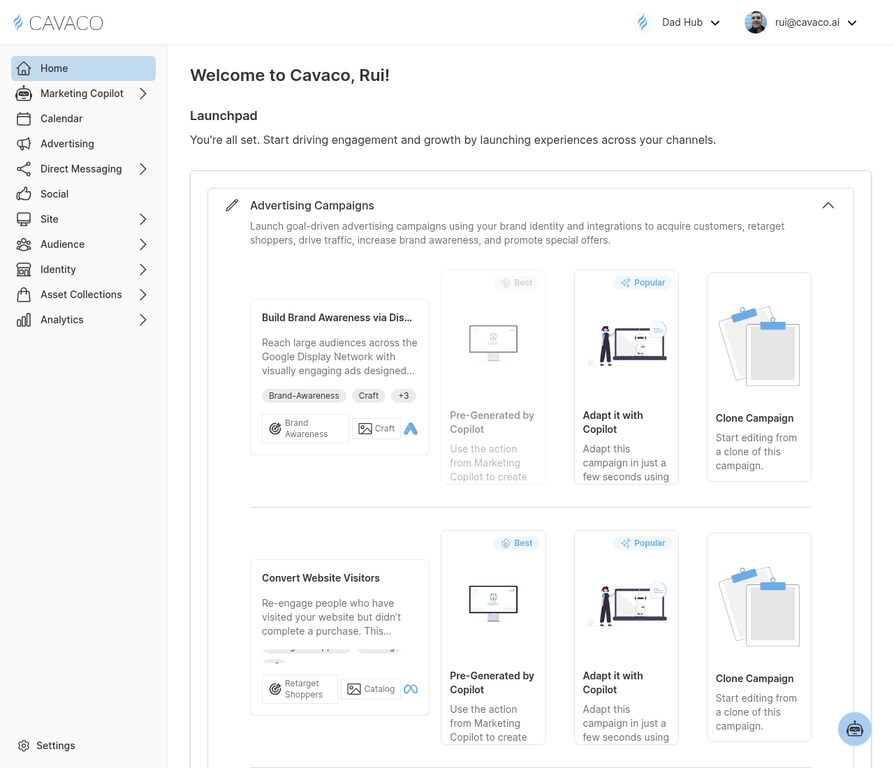
The dashboard home provides a real-time overview of your store's marketing performance.
Revenue Metrics
The top section shows your key revenue metrics for the selected time period: total revenue, revenue attributed to Cavaco campaigns, and a comparison to the previous period. The trend line shows whether you're on track relative to your historical performance.
Campaign Activity
The middle section shows recent and upcoming campaign activity — which campaigns sent recently, their performance summary, and any campaigns scheduled to send soon.
AI Recommendations
The Marketing Copilot surfaces its top recommended actions directly on the dashboard home. These are the highest-impact actions you can take right now based on your current data. Click any recommendation to execute it or learn more.
Date Range Selector
Use the date range selector in the top-right corner to change the time period for all dashboard metrics. You can compare any custom date range to the previous equivalent period to spot trends and anomalies.