Analytics & Reporting in Cavaco AI
Cavaco AI gives you a unified analytics suite that connects campaign performance, audience engagement, and revenue attribution in one place. This guide walks you through every reporting tool available, how to read the data, and how to act on it.
Guide Outline
- Understanding the Revenue Dashboard
- Campaign Performance Reports
- Audience & Engagement Analytics
- On-Site Performance Metrics
- Building Custom Reports
- Revenue Attribution Model
- Exporting Data
- Key Metrics Glossary
1. Understanding the Revenue Dashboard
The Home dashboard gives you an at-a-glance view of your store's performance over any selected date range.
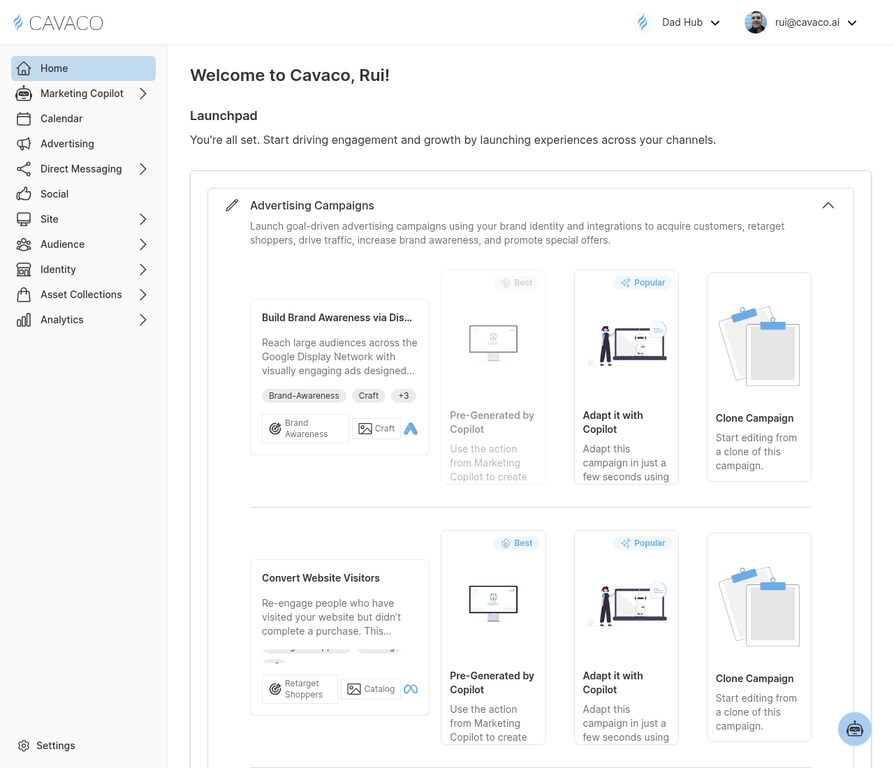
The Cavaco dashboard shows revenue, orders, AOV, and channel performance at a glance.
Key metrics displayed include:
- Total Revenue — all revenue tracked by Cavaco's pixel and attributed to your marketing activity
- Orders — total number of completed purchases
- Average Order Value (AOV) — revenue divided by orders
- New vs. Returning Customers — breakdown of customer acquisition vs. retention
Use the date range picker in the top-right to compare any two periods side by side. A green or red indicator shows whether each metric improved or declined compared to the previous period.
2. Campaign Performance Reports
Navigate to Analytics > My Reports to access detailed campaign-level reporting.
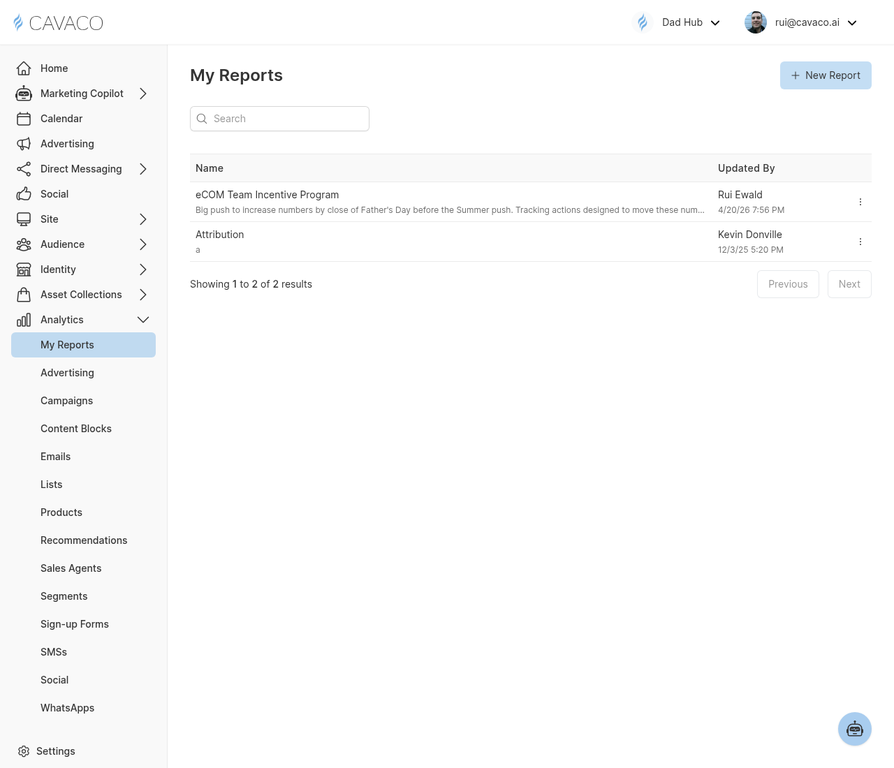
The My Reports page shows all your saved analytics reports and dashboards.
Each report shows:
- Sent / Delivered — how many messages were successfully delivered
- Open Rate — percentage of recipients who opened the email
- Click Rate — percentage who clicked at least one link
- Conversion Rate — percentage who completed a purchase after clicking
- Revenue Attributed — total revenue credited to the campaign within the attribution window
- Unsubscribes / Bounces — list health indicators
Drill into any report to see channel-level, campaign-level, and time-series performance data.
You can filter reports by campaign type (Drip, Scheduled, Advertising) and by channel (Email, SMS).
3. Audience & Engagement Analytics
Under Audience > Segments, each segment shows a live count of matching contacts.
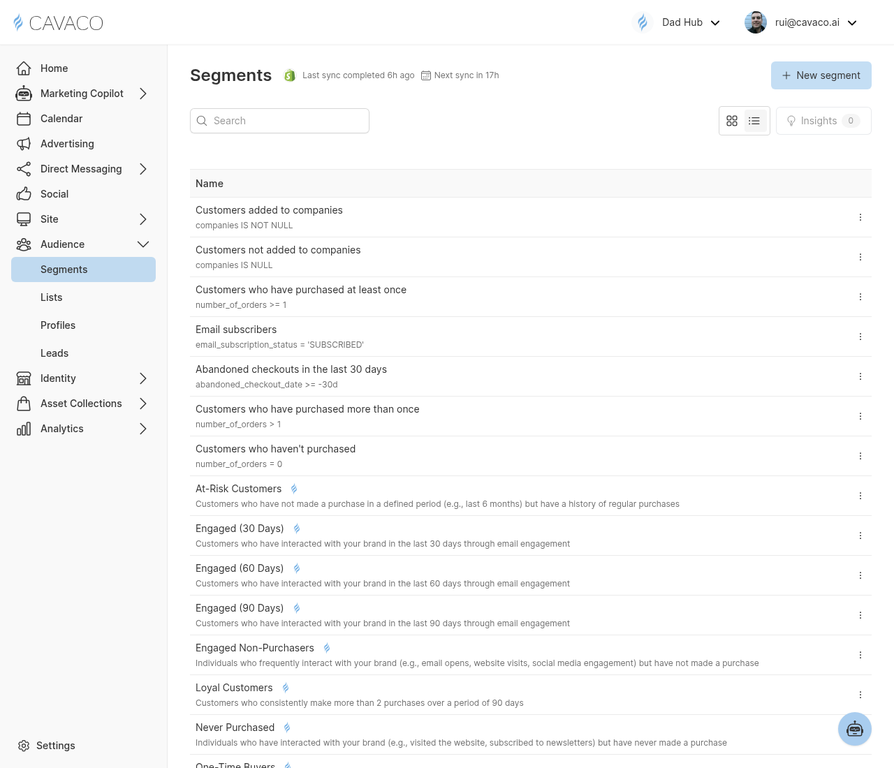
The Segments page shows all your audience segments with live contact counts and engagement data.
You can also view:
- Segment Growth Over Time — how the segment size has changed
- Engagement Score Distribution — breakdown of highly engaged, moderately engaged, and unengaged contacts within the segment
- Channel Preference — what percentage of the segment is reachable via Email vs. SMS
4. On-Site Performance Metrics
If you have installed the Cavaco Tracking Pixel, you can view on-site data including:
- Page Views — total and unique visits to tracked pages
- Product Views — which products are being viewed most frequently
- Add-to-Cart Rate — percentage of product page visitors who add to cart
- Cart Abandonment Rate — percentage of add-to-cart events that do not result in a purchase
- Widget Impressions & Conversions — performance of your Sign-up Forms, Recommendations, and Content Blocks
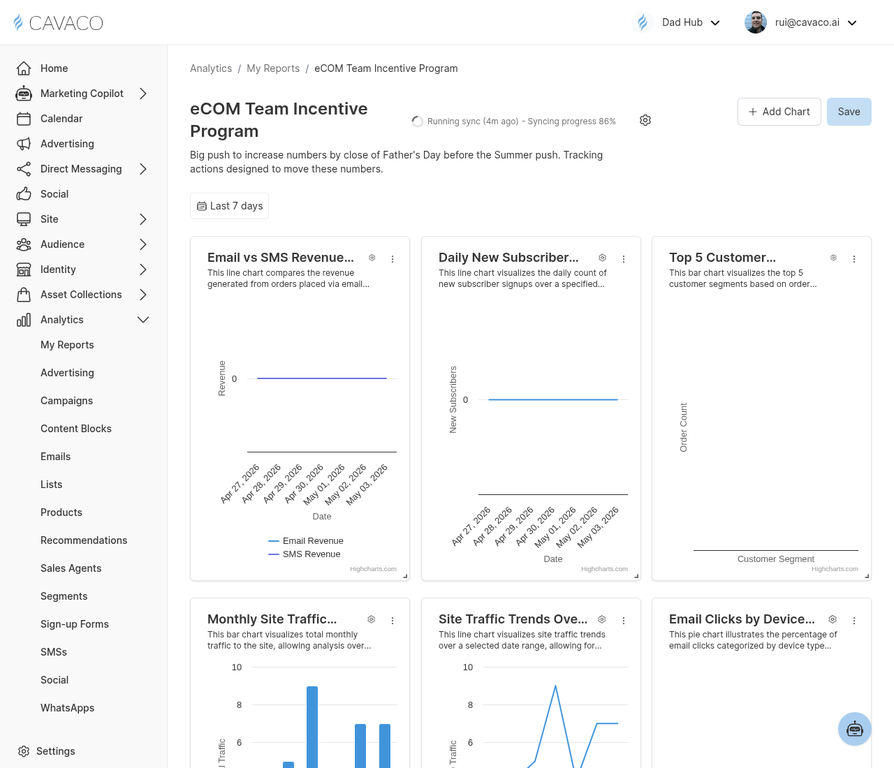
5. Building Custom Reports
Cavaco's report builder lets you create custom dashboards tailored to your KPIs.
- Navigate to Analytics > My Reports
- Click Create Report
- Select the metrics you want to track and the date range
- Add filters (e.g., by campaign, segment, or channel)
- Save and pin the report to your dashboard for quick access
6. Revenue Attribution Model
Cavaco uses a last-touch attribution model with a configurable attribution window (default: 5 days for email, 1 day for SMS). This means:
- If a customer clicks an email and purchases within 5 days, that revenue is attributed to the email campaign
- If multiple campaigns touch the same customer, the most recent touchpoint before purchase receives the credit
You can adjust the attribution window in Settings > Account > Attribution.
7. Exporting Data
All reports in Cavaco can be exported as CSV files. Click the Export button (download icon) in the top-right corner of any report view. Exported files include all visible columns and rows for the selected date range and filters.
8. Key Metrics Glossary
- Delivered Rate: (Delivered ÷ Sent) × 100. Measures how many messages successfully reached recipients.
- Open Rate: (Unique Opens ÷ Delivered) × 100. Industry benchmark: 20–25% for e-commerce email.
- Click-to-Open Rate (CTOR): (Unique Clicks ÷ Unique Opens) × 100. Measures how compelling your content is to those who opened. Benchmark: 10–15%.
- Bounce Rate: (Bounced ÷ Sent) × 100. Hard bounces are permanent failures (invalid addresses); soft bounces are temporary (full inbox). Keep below 2%.
- Spam Complaint Rate: (Spam Complaints ÷ Delivered) × 100. Keep this below 0.08% to protect deliverability.
- Revenue per Recipient (RPR): Total Revenue Attributed ÷ Number of Recipients. A key measure of campaign efficiency.
- ROAS: Return on Ad Spend = Revenue Attributed ÷ Ad Spend. For paid advertising campaigns.
- LTV: Customer Lifetime Value — the total revenue a customer is predicted to generate over their relationship with your brand.